The K-Shaped Drift

Authors & Contributors


Can resilient GDP growth weather a widening divide between consumer spending?
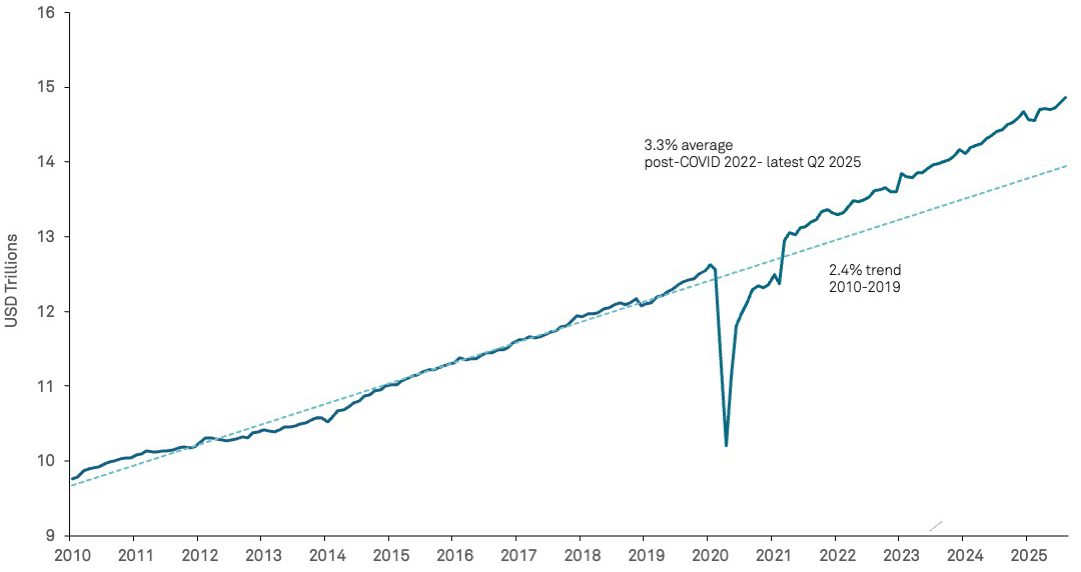
The US economy remains resilient, with real GDP on track to grow around 2% in 2025. Consumption, which makes up nearly 70% of the total, has been the backbone of expansion. Within this decade, real personal consumption has grown 3.3% per year on average, nearly a percentage point higher than the prior decade’s 2.4% trend. That above-trend growth owed in part to the tailwinds of a strong labor market and excess savings that had accumulated during the pandemic. As job creation cools and those excess savings have been utilized, the growth of spending has slowed.
Real Personal Consumption Expenditures Ex-Food and Energy
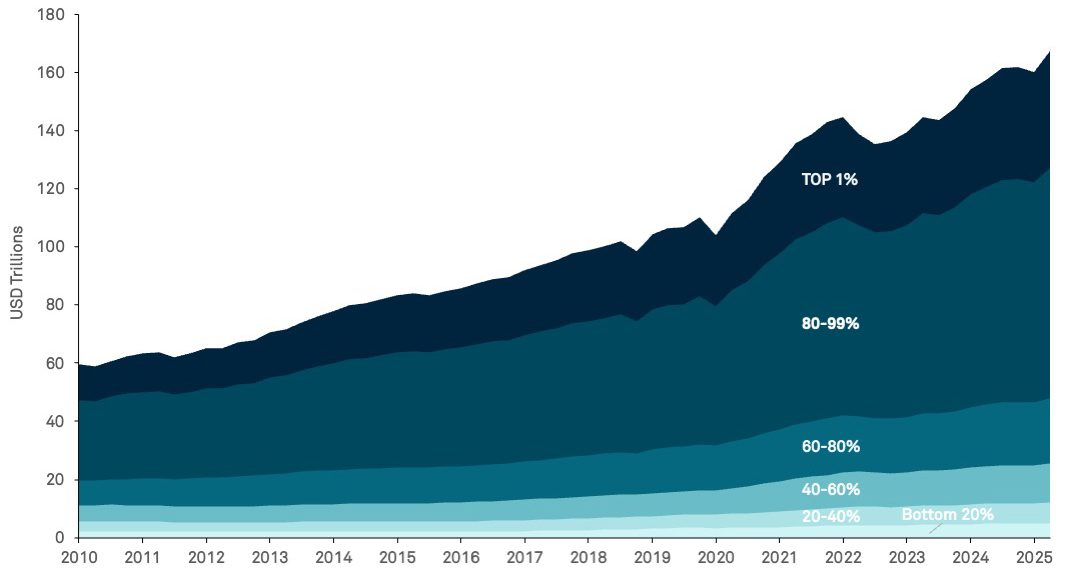
A growing concern is that consumer spending rests on the fragile foundation of a widening divide between higher and lower income households, commonly referred to as a “K-shaped economy.” As household wealth has grown it has become more concentrated. The top 20% of income earners hold 71% of total wealth. With the top 10% owning 87% of all equities, equity market gains largely flow to wealthier households. Also, equity valuations have risen sharply this year, with the S&P 500® up 14% in the year through November—performance partly driven by optimism around artificial intelligence (AI).
Wealth by Income Percentile
Lower-income consumers are under pressure from a softening job market and rising prices squeezing their budgets. According to consumer surveys, sentiment is around record lows. Lower-income households spend a higher share of their take-home pay on goods, which are categories that are susceptible to price increases due to tariffs.
The Federal Reserve (Fed), concerned about labor market vulnerability, resumed cutting rates in September as insurance against further weakness, even at the cost of slightly higher inflation in 2026. A Fed under new leadership may guide rates toward 3% by the end of 2026. Still, monetary policy is a blunt tool and cannot offset structural shifts in consumer behavior.
Our baseline view is that easing policy may provide some cushion, allowing growth to hover near trend in 2026. However, risks are still rising. Equity valuations are high by historical standards, fueled by enthusiasm for AI. A wave of AI investments could deliver meaningful productivity gains over time, but there is uncertainty about how technology firms will monetize these advances, and sentiment could shift quickly. The wealth effect works in reverse, too, and capital losses could ripple through spending, exposing the economy’s reliance on a narrow base of consumers.
The US consumer is skating on thinner ice. For now, policy support and market wealth keep the surface intact, but cracks could widen if markets falter.
PAST PERFORMANCE IS NOT NECESSARILY INDICATIVE OF FUTURE RESULTS.
All investments involve risk, including the possible loss of principal. Certain investments have specific or unique risks. No investment strategy or risk management technique can guarantee returns or eliminate risk in any market environment.
This material has been provided for informational purposes only and should not be construed as investment advice or a recommendation of any particular investment product, strategy, investment manager or account arrangement, and should not serve as a primary basis for investment decisions. Prospective investors should consult a legal, tax or financial professional in order to determine whether any investment product, strategy or service is appropriate for their particular circumstances. This document may not be used for the purpose of an offer or solicitation in any jurisdiction or in any circumstances in which such offer or solicitation is unlawful or not authorized. Views expressed are those of the author stated and do not reflect views of other managers or the firm overall. Views are current as of the date of this publication and subject to change. This information may contain projections or other forward-looking statements regarding future events, targets or expectations, and is only current as of the date indicated. There is no assurance that such events or expectations will be achieved, and actual results may be significantly different from that shown here. The information is based on current market conditions, which will fluctuate and may be superseded by subsequent market events or for other reasons. References to specific securities, asset classes and financial markets are for illustrative purposes only and are not intended to be, and should not be, interpreted as recommendations. Charts are provided for illustrative purposes and are not indicative of the past or future performance of any BNY Mellon product. Some information contained herein has been obtained from third party sources that are believed to be reliable, but the information has not been independently verified. No part of this material may be reproduced in any form, or referred to in any other publication, without express written permission.
Indices referred to herein are used for comparative and informational purposes only and have been selected because they are generally considered to be representative of certain markets. Comparisons to indices as benchmarks have limitations because indices have volatility and other material characteristics that may differ from the portfolio, investment or hedge to which they are compared. The providers of the indices referred to herein are not affiliated with Mellon Investments Corporation (MIC), do not endorse, sponsor, sell or promote the investment strategies or products mentioned herein and they make no representation regarding the advisability of investing in the products and strategies described herein. Investors cannot invest directly in an index.