A New Era of Diversification: Emerging Markets ex-China

Authors & Contributors


Although China has historically been a dominant player in the MSCI Emerging Markets Index, investors are increasingly diversifying their portfolios as China's weight in the index has decreased to around 30%.
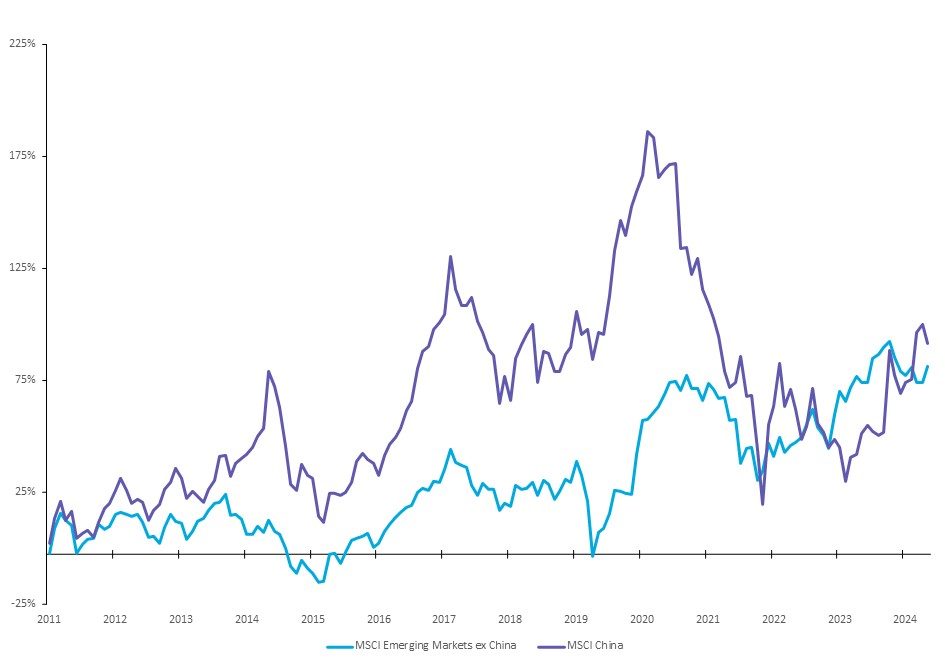
Cumulative Performance of MSCI China versus MSCI Emerging Markets Index ex-China
In the world of investing, where diversification is key to success, the old adage ‘don’t put all your eggs in one basket’ has recently taken on a newfound sense of urgency.
Over time, certain countries or companies can grow to dominate index composition, concentrating both performance and risk. For example, a group of seven large-cap US technology stocks, often referred to as the Magnificent 71, have driven a substantial portion of S&P 500® returns in recent years. Meanwhile, for Emerging Markets (EM) investors, China represented over 40% of the MSCI Emerging Markets Index at its peak, significantly influencing its trajectory.
This concentration dynamic presents opportunities for investors to consider alternative indexes designed to limit or exclude dominant exposures. Strategies such as MSCI ACWI ex-US, MSCI Emerging Markets ex-China or equal-weighted versions of traditional benchmarks offer some potential solutions. These approaches may deliver comparable long-term returns while potentially reducing volatility and idiosyncratic risks tied to a narrow set of countries or companies—particularly during periods when dominant constituents underperform or face structural challenges. The MSCI Emerging Markets ex-China may help address some of these concerns for emerging markets investors.
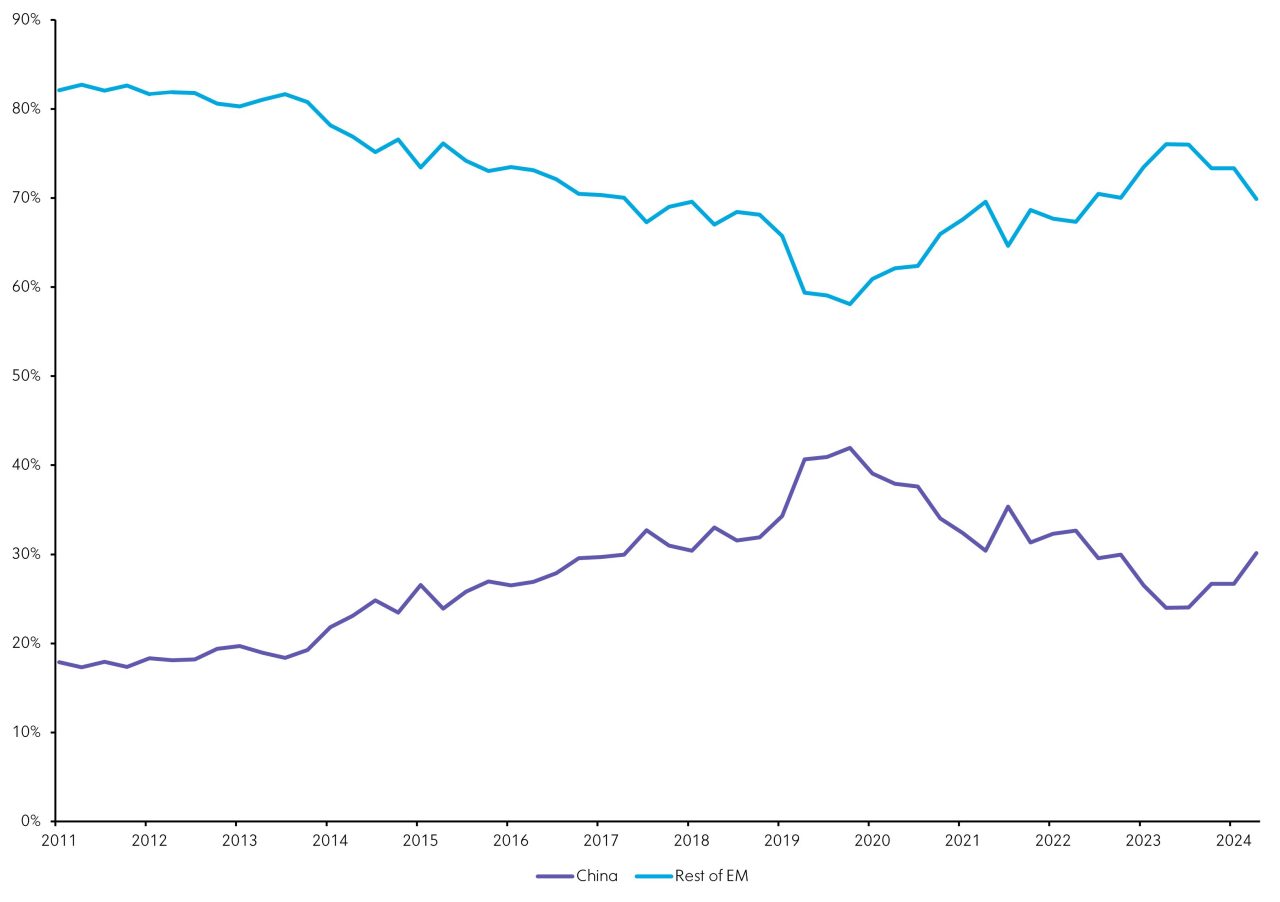
China’s path to an index heavyweight took decades to play out. It began in September 1996, when China was first included in the MSCI Emerging Markets Index with an initial weight of just 0.46%. Over the following two decades, its representation expanded as the country implemented reforms to open its capital markets, including the Qualified Foreign Institutional Investor (QFII) program in 2002 and the Stock Connect program in 2014. China reached a major milestone in 2018 with the phased inclusion of A-shares. These developments propelled China’s weight in the index to over 40% by September 2020, during the early stages of the COVID-19 pandemic. However, its share has since declined to settle around 30%, due to sustained underperformance and growing investor caution. China now faces a range of macroeconomic headwinds, including a prolonged property sector downturn, sluggish domestic demand and rising external pressures from geopolitical tensions and increasingly protectionist trade policies.
Weight of China in MSCI Emerging Markets Index vs Rest of Index
As a result, investor interest in emerging market equity strategies that exclude China has grown. As shown in the chart below, Chinese equities outperformed other emerging markets beginning in 2014, driven by reforms that improved foreign investor access. However, the post-pandemic environment has seen a reversal of this trend, as investors increasingly prioritize diversification, seek markets with stronger growth prospects and aim to reduce exposures to ongoing geopolitical tensions.
Cumulative Performance of MSCI Emerging Markets Index With and Without China
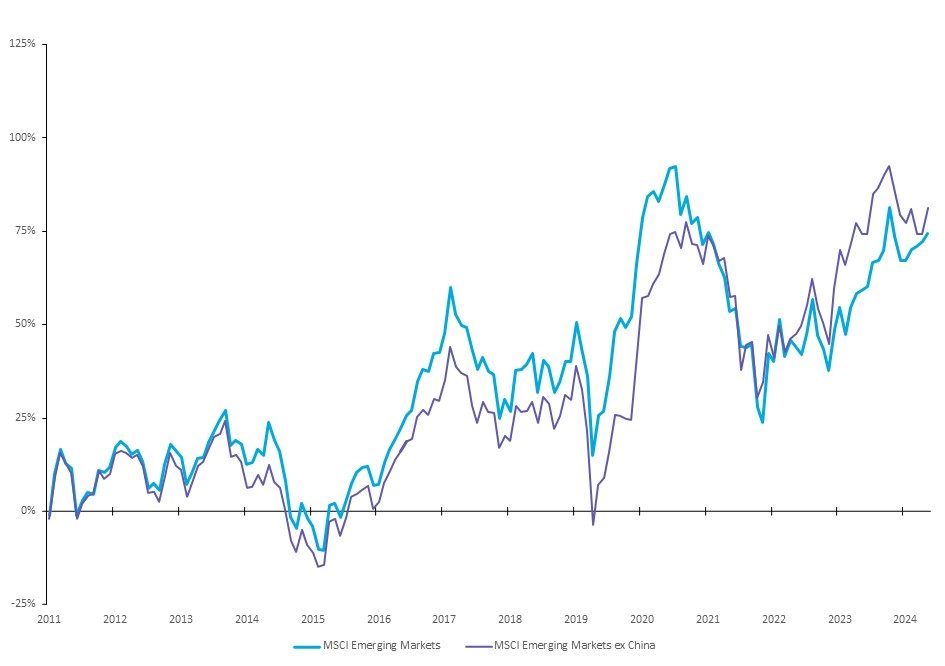
While past performance is no guarantee of future results, as discussed in our previous Macro Minute, “India’s Rise to Prominence”, the narrowing growth differential between China and the rest of the MSCI Emerging Markets Index suggests that investors may achieve similar performance with lower volatility by reducing China exposure.
1The Magnificent 7 stocks (Apple, Microsoft, Amazon, Alphabet, Meta, Nvidia and Tesla) are seven high-performing companies that significantly influence the stock market and represent a large portion of major indexes like the S&P 500.
PAST PERFORMANCE IS NOT NECESSARILY INDICATIVE OF FUTURE RESULTS.
All investments involve risk, including the possible loss of principal. Certain investments have specific or unique risks. No investment strategy or risk management technique can guarantee returns or eliminate risk in any market environment.
This material has been provided for informational purposes only and should not be construed as investment advice or a recommendation of any particular investment product, strategy, investment manager or account arrangement, and should not serve as a primary basis for investment decisions. Prospective investors should consult a legal, tax or financial professional in order to determine whether any investment product, strategy or service is appropriate for their particular circumstances. This document may not be used for the purpose of an offer or solicitation in any jurisdiction or in any circumstances in which such offer or solicitation is unlawful or not authorized. Views expressed are those of the author stated and do not reflect views of other managers or the firm overall. Views are current as of the date of this publication and subject to change. This information may contain projections or other forward-looking statements regarding future events, targets or expectations, and is only current as of the date indicated. There is no assurance that such events or expectations will be achieved, and actual results may be significantly different from that shown here. The information is based on current market conditions, which will fluctuate and may be superseded by subsequent market events or for other reasons. References to specific securities, asset classes and financial markets are for illustrative purposes only and are not intended to be, and should not be, interpreted as recommendations. Charts are provided for illustrative purposes and are not indicative of the past or future performance of any BNY product. Some information contained herein has been obtained from third party sources that are believed to be reliable, but the information has not been independently verified. No part of this material may be reproduced in any form, or referred to in any other publication, without express written permission.
Indices referred to herein are used for comparative and informational purposes only and have been selected because they are generally considered to be representative of certain markets. Comparisons to indices as benchmarks have limitations because indices have volatility and other material characteristics that may differ from the portfolio, investment or hedge to which they are compared. The providers of the indices referred to herein are not affiliated with Mellon Investments Corporation (MIC), do not endorse, sponsor, sell or promote the investment strategies or products mentioned herein and they make no representation regarding the advisability of investing in the products and strategies described herein. Investors cannot invest directly in an index.