Data Revisions and Reactions: What It All Means

Authors & Contributors


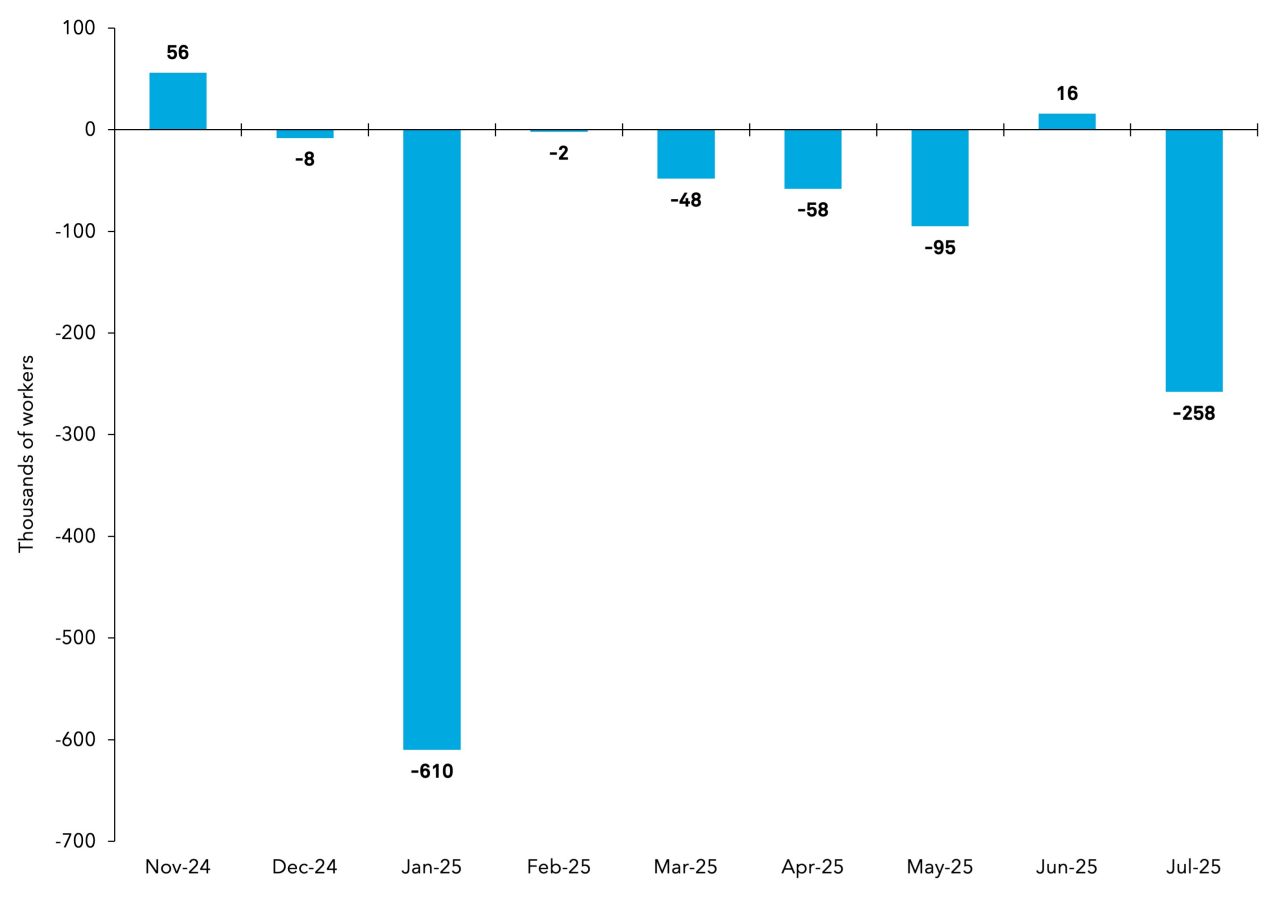
It is not often that data revisions make national news. The latest employment report showed the economy added 73,000 jobs in July, below the consensus estimate of 104,000. But more significant were the downward revisions to prior months, with the May and June jobs notched lower by a combined 258,000. Revisions are routine, but that kind of adjustment can reshape the underlying picture of labor market momentum.
The White House responded to the disappointing employment data by firing the Commissioner of the Bureau of Labor Statistics (BLS). This move was seen by some as challenging the norms on the government provision of data, leading to potential questions about data integrity going forward, which might concern some investors.
Revisions to Prior Months’ Level of Total Payroll Employment
To understand the concerns, it helps to clarify how economic data is constructed. The data that statistical agencies provide sort into two groups.
- Early measures of the universe of certain economic activities that are refined over time as data on the universe fill in.
- Samples of certain economic activities that reflect only a portion of the economy.
The monthly Employment Situation report includes both. Businesses submit payroll data, and households respond to surveys about their job status. These inputs aren’t perfect—some arrive late and others require correction. That’s why revisions to prior months are routine.
In recent years there is a pattern of downside revisions—one possible explanation being that companies who are late to report could be more likely to be suffering business stress than others. But over time, administrative records like tax filings help fill in the gaps. Not all survey questions, however, can be refined over time. For example, reasons for leaving a job or expectations about future work are inherently subjective.
In essence, statistical agencies sketch a picture of economic behavior. Sometimes that sketch is refined as more data becomes available, like the payroll data. Other times, it remains the only version. If the sketch is later corrected, any distortions – regardless of root cause – will eventually be revealed. But if the sketch is final, it becomes the historical record. Politicians may care more about the first draft because it drives headlines, but investors care about the final, hard numbers.
This brings us to another key data point: the Consumer Price Index (CPI). Unlike the employment data, the CPI relies heavily on judgmental imputations and is not revised to align with administrative records. It’s a sketch that never gets redrawn. That is potentially problematic, especially since the CPI serves as the benchmark for the over 2 trillion-dollar Treasury inflation-protected securities (TIPS) market.1
Emerging-market investors know this story well. There are usually fewer resources devoted to data collection, leading to larger margins of error and/or more frequent revisions. When that happens, the private sector usually provides an alternative. In Argentina, for example, a think tank’s inflation report eventually carried more weight than the government’s. But building trust in alternative data takes time. In the meantime, risk premiums rise.
So how big is the risk premium? One way to gauge it is through measures of political uncertainty, which track media mentions of economic policy terms. Concerns about data integrity add to that uncertainty. Historically, these measures correlate with equity volatility and credit spreads—as uncertainty goes up, volatility tends to increase, and spreads widen. Yet over the past nine months, those correlations have weakened even though measures of policy uncertainty have increased. Investors may have become receptive to risk taking—perhaps fatigued by the constant churn of headlines.
Official data and its accuracy are foundational to global financial markets. If investors were to begin to question the numbers, it is not just a headline risk—it’s a structural one. And structural risks have a way of resurfacing when least expected.
1 US Department of Treasury’s Monthly Statement of the Public Debt of the United States. July 31, 2025. Total amount outstanding $2,051,825,000,000.
PAST PERFORMANCE IS NOT NECESSARILY INDICATIVE OF FUTURE RESULTS.
All investments involve risk, including the possible loss of principal. Certain investments have specific or unique risks. No investment strategy or risk management technique can guarantee returns or eliminate risk in any market environment.
This material has been provided for informational purposes only and should not be construed as investment advice or a recommendation of any particular investment product, strategy, investment manager or account arrangement, and should not serve as a primary basis for investment decisions. Prospective investors should consult a legal, tax or financial professional in order to determine whether any investment product, strategy or service is appropriate for their particular circumstances. This document may not be used for the purpose of an offer or solicitation in any jurisdiction or in any circumstances in which such offer or solicitation is unlawful or not authorized. Views expressed are those of the author stated and do not reflect views of other managers or the firm overall. Views are current as of the date of this publication and subject to change. This information may contain projections or other forward-looking statements regarding future events, targets or expectations, and is only current as of the date indicated. There is no assurance that such events or expectations will be achieved, and actual results may be significantly different from that shown here. The information is based on current market conditions, which will fluctuate and may be superseded by subsequent market events or for other reasons. References to specific securities, asset classes and financial markets are for illustrative purposes only and are not intended to be, and should not be, interpreted as recommendations. Charts are provided for illustrative purposes and are not indicative of the past or future performance of any BNY Mellon product. Some information contained herein has been obtained from third party sources that are believed to be reliable, but the information has not been independently verified. No part of this material may be reproduced in any form, or referred to in any other publication, without express written permission.
Indices referred to herein are used for comparative and informational purposes only and have been selected because they are generally considered to be representative of certain markets. Comparisons to indices as benchmarks have limitations because indices have volatility and other material characteristics that may differ from the portfolio, investment or hedge to which they are compared. The providers of the indices referred to herein are not affiliated with Mellon Investments Corporation (MIC), do not endorse, sponsor, sell or promote the investment strategies or products mentioned herein and they make no representation regarding the advisability of investing in the products and strategies described herein. Investors cannot invest directly in an index.