Direct Indexing: The Basics of Tax Loss Harvesting

Authors & Contributors

Stephanie Hill

Brett Olsen
While a direct indexing (DI) investment strategy offers several potential benefits—which were explored in our previous article, "The Democratization of Direct Indexing"—the most prevalent is the potential to realize tax benefits by selling stocks that have lost value, then reinvesting in similar securities, which can generate tax alpha by lowering taxes owed without significantly altering the portfolio’s market exposure.
Here is a step-by-step example of this process in action.
The Tax-Loss Harvesting Process

1. Purchase Stock:
In this case, for simplicity, we are narrowing in on an initial investment of $100,000 that is made to create a single tax lot position with a $100,000 cost basis.
2. Identify Tax-Loss Harvesting Candidates (25% Stock Drawdown):
The DI manager frequently analyzes all securities in the portfolio to identify positions with unrealized losses. This is one of the main areas where DI differentiates itself from pooled investment vehicles like exchange traded funds, where investors own groups of securities which cannot be sold on an individual basis. The DI manager will identify securities that have declined below their purchase price and are eligible to be sold at a loss. At this point, the manager will monitor that such a sale complies with the Internal Revenue Service (IRS) wash sale rule, which disallows a tax deduction for a loss on the sale of a security if it is replaced with the same or a "substantially identical" security within 30 days before or after the sale.
The DI manager can determine if a security is "substantially identical" by looking for securities that have similar investment objectives or sector exposure but differ enough by issuer, share class or underlying holdings. This often means using tax-aware portfolio management tools and algorithms that track these details and apply IRS guidance to ensure substitutions maintain the investor’s desired exposure while avoiding wash sales.
In this example, the stock value declines by 25%, resulting in a market value of $75,000. This creates an unrealized loss of $25,000 ($100,000 original cost minus $75,000 current market value).
3. Tax Optimization – Harvest Tax Losses:
The DI manager realizes the $25,000 loss by selling the stock, which creates a realized tax loss of $25,000.
4. Reinvest in Similar Stocks:
To maintain the investor’s desired portfolio exposure and risk profile, the DI manager replaces the sold security with similar but not substantially identical securities as identified in step 3 and then documents the sales and replacements accurately for tax reporting and portfolio tracking.
5. Purpose of Harvesting Tax Losses:
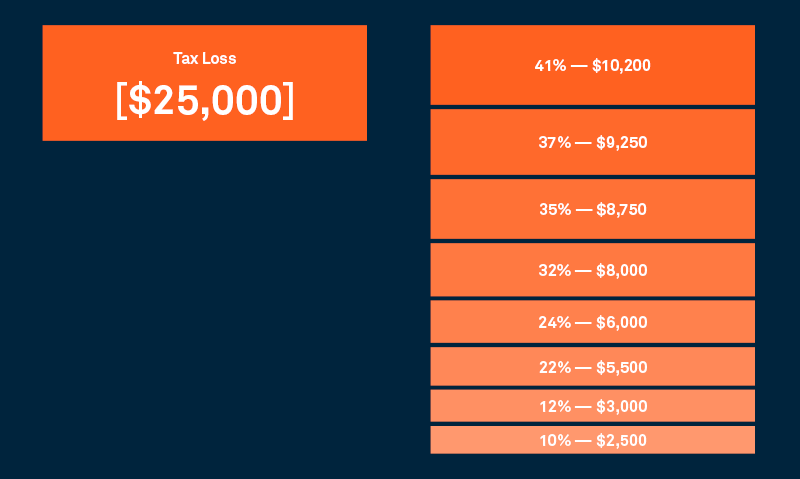
The realized tax losses can now be used to potentially offset gains and reduce overall tax liabilities of the portfolio. By applying the appropriate long- or short-term capital gains tax rate to the loss, the investor can estimate the potential amount saved in taxes based on the $25,000 loss. For instance, at a 41% tax rate, the tax savings would be $10,200; at 24%, it would be $6,000, and so on.1
Estimated Potential Tax Savings Based on $25,000 Loss
Conclusion
In our view, the tax-loss harvesting potential of a direct indexing strategy may provide an effective means to improve the after-tax performance of an investor’s portfolio. Contact a BNY Investments Mellon representative to learn more about direct indexing.
This material is provided for illustrative/educational purposes only. This material is not intended to constitute legal, tax, investment or financial advice. Effort has been made to ensure that the material presented herein is accurate at the time of publication. However, this material is not intended to be a full and exhaustive explanation of the law in any area or of all of the tax, investment or financial options available. The information discussed herein may not be applicable to or appropriate for every investor and should be used only after consultation with professionals who have reviewed your specific situation.
1Highest bracket percentage + surcharge. Does not reflect actual results.
PAST PERFORMANCE IS NOT NECESSARILY INDICATIVE OF FUTURE RESULTS.
All investments involve risk, including the possible loss of principal. Certain investments have specific or unique risks. No investment strategy or risk management technique can guarantee returns or eliminate risk in any market environment.
This material has been provided for informational purposes only and should not be construed as investment advice or a recommendation of any particular investment product, strategy, investment manager or account arrangement, and should not serve as a primary basis for investment decisions. Prospective investors should consult a legal, tax or financial professional in order to determine whether any investment product, strategy or service is appropriate for their particular circumstances. This document may not be used for the purpose of an offer or solicitation in any jurisdiction or in any circumstances in which such offer or solicitation is unlawful or not authorized. Views expressed are those of the author stated and do not reflect views of other managers or the firm overall. Views are current as of the date of this publication and subject to change. This information may contain projections or other forward-looking statements regarding future events, targets or expectations, and is only current as of the date indicated. There is no assurance that such events or expectations will be achieved, and actual results may be significantly different from that shown here. The information is based on current market conditions, which will fluctuate and may be superseded by subsequent market events or for other reasons. References to specific securities, asset classes and financial markets are for illustrative purposes only and are not intended to be, and should not be, interpreted as recommendations. Charts are provided for illustrative purposes and are not indicative of the past or future performance of any BNY product. Some information contained herein has been obtained from third party sources that are believed to be reliable, but the information has not been independently verified. No part of this material may be reproduced in any form, or referred to in any other publication, without express written permission.
Indices referred to herein are used for comparative and informational purposes only and have been selected because they are generally considered to be representative of certain markets. Comparisons to indices as benchmarks have limitations because indices have volatility and other material characteristics that may differ from the portfolio, investment or hedge to which they are compared. The providers of the indices referred to herein are not affiliated with Mellon Investments Corporation (MIC), do not endorse, sponsor, sell or promote the investment strategies or products mentioned herein and they make no representation regarding the advisability of investing in the products and strategies described herein. Investors cannot invest directly in an index.