Signs of Slack in the Labor Market

Authors & Contributors


The average monthly job gains dropped to just 29,000 in the August Bureau of Labor Statistics jobs report.
Labor market concerns are back in focus after a series of soft job reports. Since April, labor demand has cooled meaningfully, and August showed more of the same pattern with the three-month average of job gains declining to just 29,000. Manufacturing payrolls fell 12,000 in August marking the fourth monthly decline since April’s Liberation Day.
Another sign of growing slack has been the decline in the job-to-applicant ratio, or the ratio of total job openings to the number of unemployed. The ratio in July dipped below parity for the first time in over four years. On September 9, the Bureau of Labor Statistics (BLS) signaled that it could reduce the reported job growth in the year through March 2025 by up to 911,000 jobs when it releases its final annual benchmark revisions early next year. That indicates recent labor market slowing followed a period of more moderate job growth than previously reported.
The Federal Reserve (Fed) is sensitive to shortfalls in employment, and these signs of slack have strengthened the case to resume monetary policy easing. After holding rates steady at 4.25% to 4.5% since last December, the Federal Open Market Committee (FOMC) appears poised to deliver a rate cut at its September meeting, which will be the first move lower this year. The shift reflects growing concern that policy is too tight given the softening in labor demand and the lagged effects of tight monetary policy.
Job Openings and Number of People Unemployed
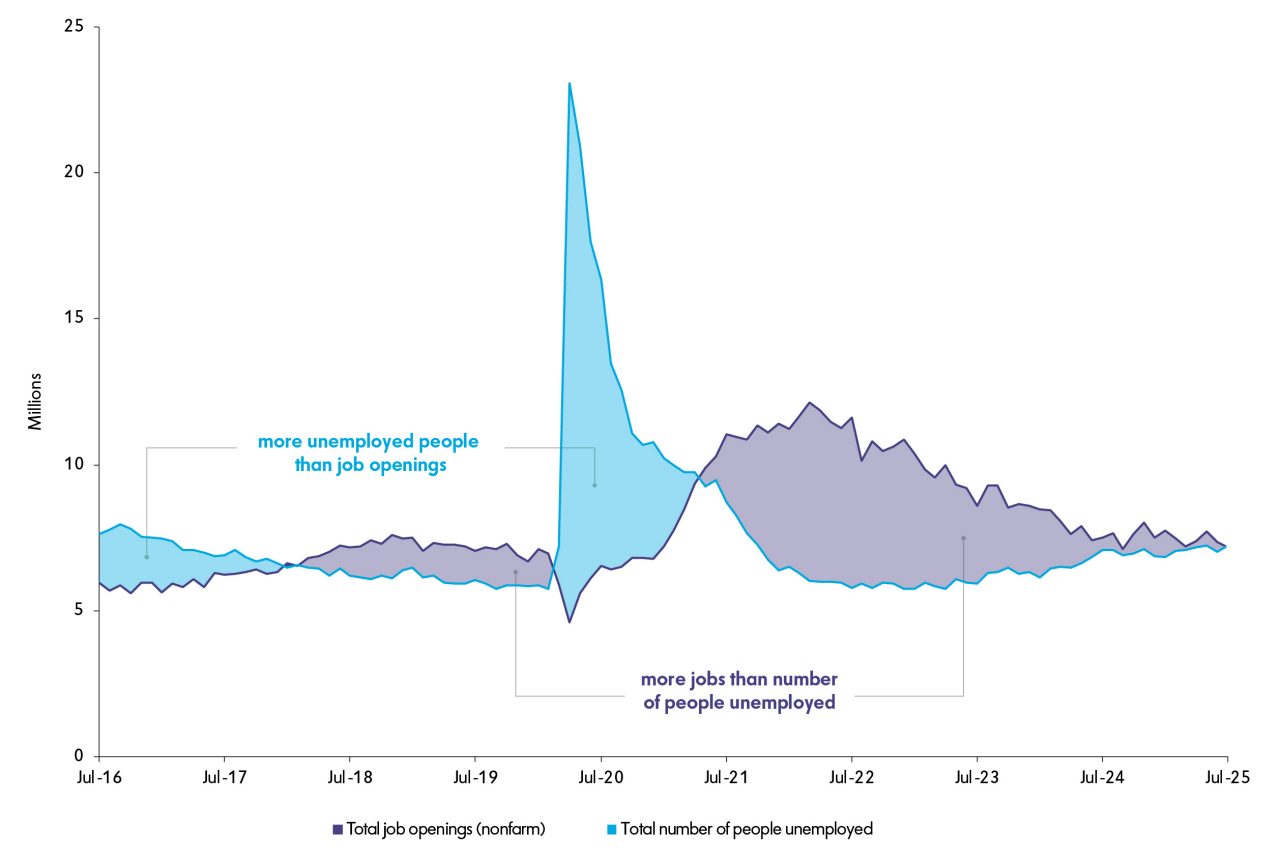
The center of gravity within the Fed may be shifting. The bias may increasingly tilt toward Board members who favor cutting rates more quickly and substantially, with the goal of easing financial conditions and keeping the labor market from deteriorating further. But the Fed does not have a free hand. Core personal consumption expenditures (PCE) inflation is still running at 2.9% year-over-year, above the 2% target, and tariff-driven price pressures are building. It will take time for tariffs to work through the system and there is a risk that inflation expectations may start to drift. As the above chart illustrates, signs of slack in the labor market are building, and how the Fed sizes up that slack will help determine the pace of easing.
PAST PERFORMANCE IS NOT NECESSARILY INDICATIVE OF FUTURE RESULTS.
All investments involve risk, including the possible loss of principal. Certain investments have specific or unique risks. No investment strategy or risk management technique can guarantee returns or eliminate risk in any market environment.
This material has been provided for informational purposes only and should not be construed as investment advice or a recommendation of any particular investment product, strategy, investment manager or account arrangement, and should not serve as a primary basis for investment decisions. Prospective investors should consult a legal, tax or financial professional in order to determine whether any investment product, strategy or service is appropriate for their particular circumstances. This document may not be used for the purpose of an offer or solicitation in any jurisdiction or in any circumstances in which such offer or solicitation is unlawful or not authorized. Views expressed are those of the author stated and do not reflect views of other managers or the firm overall. Views are current as of the date of this publication and subject to change. This information may contain projections or other forward-looking statements regarding future events, targets or expectations, and is only current as of the date indicated. There is no assurance that such events or expectations will be achieved, and actual results may be significantly different from that shown here. The information is based on current market conditions, which will fluctuate and may be superseded by subsequent market events or for other reasons. References to specific securities, asset classes and financial markets are for illustrative purposes only and are not intended to be, and should not be, interpreted as recommendations. Charts are provided for illustrative purposes and are not indicative of the past or future performance of any BNY Mellon product. Some information contained herein has been obtained from third party sources that are believed to be reliable, but the information has not been independently verified. No part of this material may be reproduced in any form, or referred to in any other publication, without express written permission.
Indices referred to herein are used for comparative and informational purposes only and have been selected because they are generally considered to be representative of certain markets. Comparisons to indices as benchmarks have limitations because indices have volatility and other material characteristics that may differ from the portfolio, investment or hedge to which they are compared. The providers of the indices referred to herein are not affiliated with Mellon Investments Corporation (MIC), do not endorse, sponsor, sell or promote the investment strategies or products mentioned herein and they make no representation regarding the advisability of investing in the products and strategies described herein. Investors cannot invest directly in an index.